 By Gustavo Torres
Albarán's support assistant, from the invented company of the previous article, recently learned to search in a loop. It no longer answers "no" to the ticket 4812 question: it reads the ticket, takes the customer's plan from it, looks up the terms of that plan and answers correctly, with two citations. Until the head of support asks it something else:
Why are customers asking us for refunds this quarter?
The assistant goes round three times, reads twenty tickets and answers with six citations:
The two main reasons are the double charges after the payment gateway change, in August, and the Basic plan price rise, in July. [Tickets 4182, 4377, 4590, 4821, 4903, 5011]
All six citations exist, and each says what the answer says it says. And the answer is wrong. Between July and September there are 900 tickets in which a customer asks for money back or to cancel. The most common cause, with 340, is missing: since version 3.2, released in July, credit notes export to PDF with the wrong VAT total, and the customers who need them want to leave. Their tickets talk about "credit notes", "PDF", "cancelling" and "money back", and almost never say "refund". The twenty the assistant read were the ones that looked most like the question, and the question said "refund".
Nothing the previous article fixed helps here. It isn't a matter of aim: every ticket it retrieved really is about refunds. Nor is it a matter of control: the model decided what to search for, searched three times and stopped when it thought it had enough. The problem is the question. Every question in that article had its answer written in some document, and the job was to find it. Not this one. No ticket says "the main cause of this quarter's refunds is version 3.2". The answer is in the whole, and a search engine returns fragments: a sample, which the model summarises as if it were the whole. The Microsoft paper that named GraphRAG in 2024 describes this failure almost word for word: "samples of retrieved facts falsely presented as global summaries".
GraphRAG is usually told as the next step for RAG: the same system with a graph inside, and better. That version has two problems. The first is that "GraphRAG" doesn't name one technique but at least three, which share only the word "graph" and answer different questions. The second is that, measured carefully, a graph makes the answers to simple questions worse, and it's expensive. Here are the three, with their sources, and at the end the question that matters: when you need each one, and when you need none.
Four places an answer can live
Before talking about graphs, it helps to look at the questions. The same knowledge base, Albarán's, takes questions whose answers live in very different places:
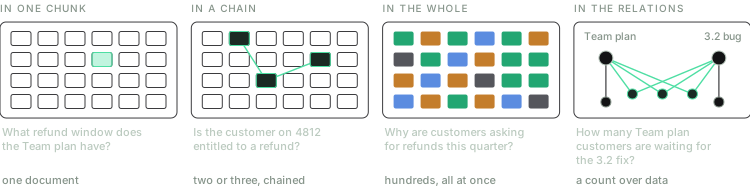
Four questions about the same documents. The previous article solved the first two; the last two are GraphRAG's territory.
In one chunk. "What refund window does the Team plan have?" is answered, whole, by section 7 of the plan's terms. It's the question RAG was invented for, and the previous article's hybrid search handles it on its own.
In a chain. "Is the customer on ticket 4812 entitled to a refund?" needs two documents, and the second can only be searched for after reading the first. It's the multi-hop question, the one agentic RAG solves by going round.
In the whole. "Why are customers asking for refunds this quarter?" isn't answered by any document or any short chain. The answer is a summary of hundreds of tickets, and to write it you have to have read them all.
In the relations. "How many Team plan customers are waiting for the 3.2 fix?" has a number for an answer: 23. A number like that isn't retrieved but computed, by crossing which plan each customer has with which tickets they have opened.
What happened to the assistant shows when you compare what there was with what it read:
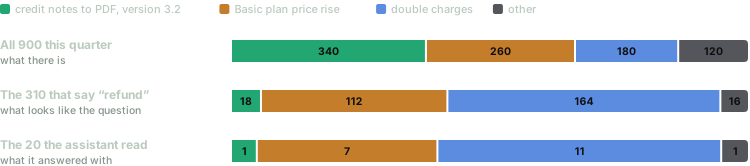
Someone who has paid twice asks for a refund; someone who can't issue a credit note asks to cancel. The search chose among the tickets that looked like the question, and the sample was skewed before the model read a word.
A search engine ranks by resemblance to the query, and resemblance isn't representativeness. Going round more times doesn't fix it. An agent can search six times instead of three and read 120 tickets instead of 20, but it writes each query from what it has already read, and nothing it has read makes it think of a PDF. It's failure 4 from the previous article (the term you need to search for is inside a result) at the scale of the corpus: here it's inside 340 results the search never returns. And even if it read them all, a search can't count.
In these two articles, "agent" doesn't mean the system does things in the world, like issuing a refund or sending an email: it means the model decides the steps. Albarán's assistant only reads, and it is still an agent in that sense.
That leaves pasting everything into the context. Nine hundred tickets fit in a million-token window, and for a question asked once that may be the sensible choice. But the question will come back every quarter, a year of tickets no longer fits, and the previous article described what happens to information left in the middle of a long context.
What a graph is, and where it comes from
A knowledge graph stores facts as triples: a subject, a relation and an object. (Ortega Hardware, has, Team plan). (ticket 5120, affects, version 3.2). Each subject and each object is a node, and each relation an edge between two nodes. What a graph can do, and a pile of fragments can't, is follow an edge: from the ticket you reach the customer, from the customer the plan and from the plan its terms, without any document containing all three facts at once.
The idea predates language models. In May 2012 Google introduced its Knowledge Graph with a slogan that sums up the shift, "things, not strings", and more than 500 million objects and more than 3.5 billion facts and relationships between them. For the following decade, a graph like that was something companies built with teams dedicated to deciding the schema and filling it in. Language models didn't change the idea. They changed who fills in the graph.
Today a graph can come from three places, and the place decides what the graph can answer.
It already exists. At Albarán, the CRM (customer relationship management system, where the company keeps its customers and their commercial history) knows which plan each customer has, and the ticketing system knows which customer opened each ticket, what state it's in and which others it's linked to. Nobody had to extract those relations: someone wrote them down, field by field, when they happened. They're exact and cheap to query, and they only contain what someone decided to store.
A language model extracts it by reading the text. Each fragment goes to the model, which is asked to return the triples it contains:
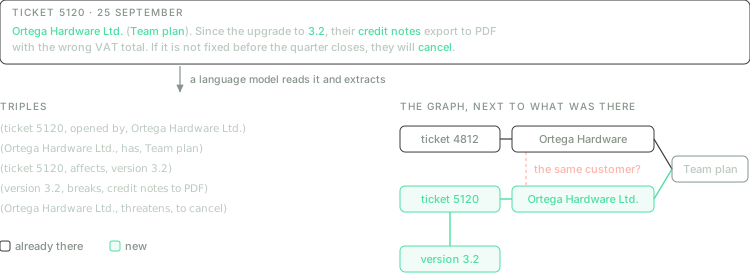
The ticket Ortega Hardware opened on 25 September, turned into triples. The model doesn't know that "Ortega Hardware" and "Ortega Hardware Ltd." are the same customer, and the graph ends up with two nodes for it.
It's the richest option, because it pulls out relations that aren't in any field (no column in any table says that version 3.2 breaks credit notes), and it has three costs. The first is money: the whole corpus has to go through the model, and whatever changes has to go through again. The second is the one in the figure: reconciling the different names of the same thing is a problem with a name of its own, entity resolution, and Microsoft's GraphRAG paper solved it with the simplest rule possible, that two nodes are the same if their names match letter for letter. The third is what gets lost. In a 2025 controlled comparison, the graph GPT-4o-mini extracted from the documents of HotpotQA, a set of multi-hop questions over Wikipedia articles, contained 65.8% of the entities that were the answer to some question. One answer in three wasn't in the graph, even though it was in the text. The authors chose that model for cost. With GPT-4o extracting the graph, the answers improved consistently, though they didn't recount how many entities were lost.
Cheap processing extracts it. No language model: the noun phrases of each fragment are pulled out with classic language-processing techniques, and the ones that appear together are joined. The resulting graph is crude (it says two concepts go together, not how they're related), and it costs the same as indexing for plain RAG.
With those three sources, the techniques sold as GraphRAG do three different things: they use the graph as a map, they use it as a memory, or they query it. In that order.
The graph as a map: summarising the whole
Before the graph, a tree
The first serious answer to global questions had no graph. RAPTOR, published in January 2024 by a group at Stanford, clusters a document's fragments by similarity, has a model write a summary of each cluster, clusters the summaries and summarises them again, and repeats until it has a tree whose leaves are the original text and whose root summarises the whole document. At query time it searches all levels at once: a specific question lands in the leaves, a general one in the summaries. The paper motivates it with a question about a fairy tale, "How did Cinderella reach her happy ending?", which no short fragment answers, and with GPT-4 it improved the best published result on QuALITY, a set of questions about long texts, by 20 absolute points.
RAPTOR groups by textual similarity. GraphRAG groups by connected entities.
GraphRAG, piece by piece
From Local to Global, the Microsoft Research paper published in April 2024 (the code came out in July), turns the corpus into a map before any question arrives:
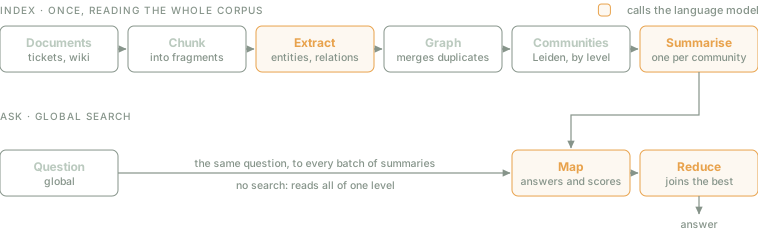
The same two lanes as the RAG in the previous article. What changes is where the model sits: at indexing time it reads the whole corpus twice, once to extract and once to summarise, and at query time there is no search.
Extract. Each fragment goes through a model that returns entities, relations and claims (dates, facts, events), each with a short description. A relation that appears in many fragments becomes a heavier edge.
Communities. Leiden, a 2019 algorithm that splits a graph into groups of nodes more connected to each other than to the rest, runs over the graph. It works by levels: large groups, subgroups inside them, and so on until nothing more can be split. Leiden fixes Louvain, the classic algorithm for the task, which in its authors' experiments left up to 16% of communities disconnected.
Summarise. Each community gets a report written by the model, bottom up: small communities are summarised from their entities and relations, and large ones from their subcommunities' reports. The result is an index you can read without asking anything: one report per theme, at several scales.
Ask. Global search doesn't search. It takes all the reports of one level, shuffles them, splits them into batches that fit in the context and asks each batch the same question. In that step, called map, each batch returns a partial answer and a score from 0 to 100 for how much it helps, and the ones scored 0 are dropped. The reduce step sorts the rest by score and joins the best, until the context is full, into the final answer. There is also a local search, which starts from the question's entities and gathers their neighbourhood in the graph, meant for specific questions.
With Albarán's tickets, the difference is in the extraction. The model reads the 340 version 3.2 tickets even though they don't say "refund", and in all of them it finds the same entities: version 3.2, credit notes, the PDF export. Those entities end up tightly connected, Leiden puts them in the same community and the model writes it a report about customers threatening to cancel because their credit notes come out wrong. When the head of support's question arrives, that report already exists, and in the map step it scores high. No search had to hit on the word "PDF".
What the map gives you is the shape of the whole: which themes there are and, with luck, which weighs most. It doesn't give an exact count (a report says "many customers", not "340"). That is the third family's job.
How they measured it. On two corpora of about a million tokens, transcripts of a technology podcast and a set of news articles, one model generated 125 global questions per corpus, imagining users and tasks, and another model acted as judge, comparing answers in pairs. Against plain RAG, GraphRAG's answers won on comprehensiveness between 72 and 83% of the time, and on diversity between 62 and 82%. Plain RAG won on the control criterion, how direct the answer was. And answering from the top-level reports, the most summarised ones, cost over 97% fewer tokens per question than applying the same map-reduce to the original text, at little loss.
Two asterisks, which the comparisons section comes back to. There were no reference answers: a judge model decided everything. And the map is paid for up front: indexing the podcast, about 1,700 chunks of 600 tokens, took 281 minutes of calls to GPT-4 Turbo.
Paying for the reading at query time
The map is paid for in full before the first question, and every new document changes entities, relations and communities, whose reports have to be rewritten. If the corpus changes every day, or if you'll ask it few global questions, the map never pays for itself. Almost everything that came after GraphRAG is a way of paying less.
LightRAG, by researchers in Hong Kong and Beijing, in October 2024, drops the communities. It keeps the graph next to a vector index, and at query time the model writes two kinds of keys: specific ones, which look for entities, and general ones, which look for relations and themes. A new document is added to the graph without rebuilding anything. By its own authors' count, on a legal corpus, GraphRAG's global search read 610 reports of about 1,000 tokens per question, across hundreds of calls, while LightRAG used fewer than 100 tokens in a single one.
LazyGraphRAG, from Microsoft itself, in November 2024, takes the idea to the extreme, and the name says it: it's lazy. It doesn't use the language model at indexing time. It extracts noun phrases, joins them by co-occurrence and derives the communities from graph statistics, so indexing costs the same as for plain RAG, 0.1% of what full GraphRAG costs. All the work happens at query time. The question is split into three to five subquestions; for each one, the fragments are ranked by similarity and the communities by their best fragments; a model judges, sentence by sentence, whether what it reads is relevant; and the search goes down into subcommunities when several in a row contribute nothing. A single parameter, the relevance test budget (100, 500 or 1,500 in their experiments), sets how much each question spends. In Microsoft's evaluation, on 5,590 AP news articles, it matched GraphRAG's global search on global questions at a query cost more than 700 times lower.
That is the variable that organises this branch: when you pay for reading the corpus. GraphRAG pays all of it at indexing time, so each global question is fast; LazyGraphRAG pays almost nothing at indexing time and pays, at query time, whatever each question needs. Which one suits you depends on how many global questions you'll ask the same corpus.
The graph as memory: connecting in one step
The second family uses the graph for something else. It doesn't want to summarise the corpus, but to find what is connected to the question even when it doesn't look like it.
The ticket 4812 question is the example. The assistant in the previous article solved it in three turns: it searched for the ticket, read in it that the customer was on the Team plan, and then searched for that plan's terms. Three model calls and two searches, one after the other, to follow a chain that a graph already has drawn: ticket 4812 is linked to Ortega Hardware, Ortega Hardware to the Team plan and the Team plan to its terms.
HippoRAG, published in May 2024 by Ohio State University and Stanford, exploits exactly that, and does it by borrowing from a theory of human memory. The hippocampal indexing theory, from 1986, proposes that memories are stored in the cortex and that the hippocampus stores something else: an index of associations between them, which retrieves a whole memory from a partial cue. In HippoRAG, the language model plays the cortex: it reads each passage and extracts its triples, with no fixed schema. The graph of those triples plays the hippocampus. And an embedding model adds synonym edges between very similar phrases, which is an approximate solution to the "Ortega Hardware" and "Ortega Hardware Ltd." problem.
At query time, the model pulls the entities out of the question, they are located in the graph, and from them a Personalized PageRank runs: a random walk over the graph that at every step has a fixed probability of jumping back to the starting nodes (0.5 in HippoRAG). After many steps, probability builds up in the nodes near the starting ones, and more in those near several at once. Each passage gets the sum of the probability of the phrases it contains. One detail matters: each starting node weighs less the more passages mention it, which is what lexical search does with common words. "4812" appears in one passage; "refund", in many.
On a toy Albarán index, the calculation gives this:
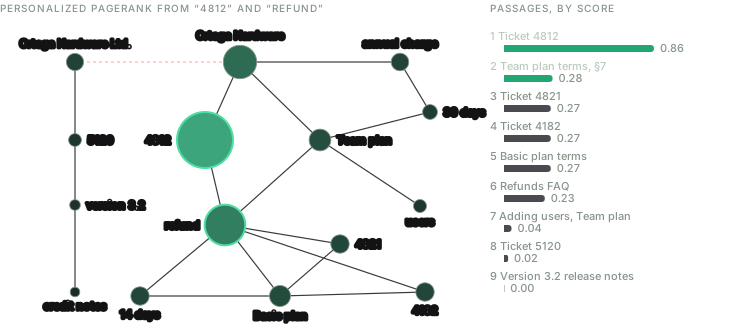
The graph is invented; the ranking on the right is computed, with Personalized PageRank and HippoRAG's weighting. The first two passages are the two that were needed.
The first two passages are exactly the ones that were needed, and they come out of a single search. Nobody wrote the word "Team": probability reached the Team plan from the ticket, through the customer, and from there the plan's terms. In this graph the terms' lead over the next passage is small, 0.28 against 0.27, because in a nine-passage index almost everything that mentions "refund" scores alike. In a real index, "refund" appears in hundreds of passages and its weight is spread across all of them.
On multi-hop question sets, HippoRAG beat the best published retrievers by up to 20 points, and its single-step search matched or beat IRCoT, the method that interleaves search and reasoning in a loop and that the previous article introduced alongside ReAct, while being 10 to 20 times cheaper and 6 to 13 times faster.
There is one case where this memory does something the agent genuinely struggles with. The HippoRAG paper illustrates it with a question: "Which Stanford professor works on the neuroscience of Alzheimer's?". In a corpus with thousands of passages about Stanford professors and thousands about Alzheimer's researchers, none says both. An agent doesn't know where to start: any search returns hundreds of candidates from one side or the other. Personalized PageRank starts from both nodes at once, and probability builds up in the professor linked to both.
The comparisons exposed this family's problem. A graph of triples loses detail, and on single-fact questions the graph methods did worse than plain RAG. HippoRAG 2, from February 2025 and presented at ICML 2025 (International Conference on Machine Learning, one of the major machine learning conferences), fixed it by putting the passages into the graph as nodes of their own and having the model discard, at query time, the triples that aren't relevant. According to its authors, it beats plain RAG on single-fact questions, on long-text comprehension and on multi-hop questions, where it improves on the best embedding model they tried by 7%.
The graph you already have: query it, don't retrieve it
Albarán's third question needs nobody to extract any graph:
How many Team plan customers have an open ticket about the 3.2 credit notes bug?
The answer is 23, and neither a search engine nor a map can give it. A search engine returns a sample; the map, a report that says "many customers"; a graph extracted by a model, a count over a graph that may be missing one entity in three. But the relations needed are already stored, and they're exact: the CRM knows which plan each customer has, and the ticketing system knows who opened each ticket, whether it's still open and which bug it's linked to. What the model has to do isn't retrieve, but write a query:
MATCH (c:Customer)-[:HAS]->(:Plan {name: "Team"}),
      (c)-[:OPENED]->(:Ticket {status: "open"})-[:LINKED_TO]->(:Bug {id: "PDF-CREDIT-3.2"})
RETURN count(DISTINCT c)
It's in Cypher, the query language of the Neo4j graph database, but the same question can be written in SQL over the CRM's tables, and today's models write both well. The database does the counting, and it doesn't miscount.
The published case closest to Albarán comes from LinkedIn. Its support system, presented at SIGIR 2024 (Special Interest Group on Information Retrieval, the main conference on search and information retrieval), starts from a simple observation: a Jira ticket isn't plain text. It has sections (summary, description, priority, root cause, steps to reproduce) and explicit links to other tickets, such as "cloned from". The system turns each ticket into a tree of sections, joins the trees with those links and with implicit ones, between tickets with similar titles, and stores the result in Neo4j. At query time, a model identifies which sections and values the question mentions, locates the tickets with embeddings section by section and rewrites the question as a Cypher query over the graph, along the lines of "give me the steps to reproduce ticket ENT-22970". Against a RAG over the tickets' text, the mean reciprocal rank (a metric worth 1 if the correct ticket comes first, 1/2 if it comes second, and so on) rose from 0.522 to 0.927, 77.6%. In production, they split their support team at random into two groups for about six months, and the group using the system resolved each ticket in a median of 5 hours, against 7: 28.6% less. Two warnings when reading it. The paper doesn't say how many questions were in the set they measured with, and the production comparison is against the group working without the tool, not against another RAG.
When the graph is huge and public, like Wikidata, the query can't always be written in one go, because the model doesn't know its relations. Think-on-Graph, presented at ICLR 2024 (International Conference on Learning Representations, another of the major machine learning conferences), has the model explore it like an agent: it starts from the question's entities, at each step chooses which relations to follow and keeps the most promising paths, in a beam search. Its example is "What is the majority party now in the country where Canberra is located?". The model on its own answers with what it knew in 2021. A query written in one go in SPARQL, the standard query language for this kind of graph, fails because the graph has no "majority party" relation. Exploring, the model goes from Canberra to Australia, from Australia to its prime minister and from the prime minister to the party. Without training anything, it achieved the best published result on 6 of the 9 question sets it tried.
This family has its own limit. A comparison of twelve graph methods, published at VLDB 2025 (Very Large Data Bases, one of the two major database conferences), found that the ones that answer from the graph alone, like Think-on-Graph, do badly when the answer is in a text: without the original fragments, the details are missing. Querying the graph is right when the answer is a relation. When it's a sentence, you have to go back to the text.
The practical rule is short. If a relation is already in a database, query it. Extracting it from text with a language model means building, at great cost, a worse copy of something you already had.
What the comparisons say
Between 2024 and 2026, dozens of GraphRAG variants appeared, nearly all evaluated by their authors on their own questions. Since 2025 there have been controlled comparisons: the same corpora, the same model, the same conditions. Four of them help you decide.
RAG and GraphRAG complement each other. The 2025 comparison that counted the lost entities found that plain RAG wins on single-hop questions and on those asking for a specific detail, and GraphRAG on multi-hop ones. Microsoft's global search, in particular, sacrifices detail: against reference summaries written by people, plain RAG's summaries were closer. And the most uncomfortable finding is about evaluation. When a judge model compares two summaries, changing the order in which it reads them changes the verdict, in some cases reversing it. With the order controlled and questions about specific characters or events, the judge preferred plain RAG on comprehensiveness and global search on diversity. It's the same kind of judge that underpinned GraphRAG's original results, though those questions really were global.
The graph helps when the question gets harder, and gets in the way when it's simple. GraphRAG-Bench (ICLR 2026) measures seven graph methods against plain RAG, on novels and medical guidelines, with questions of increasing difficulty. On single-fact questions, plain RAG retrieves 83.2% of the evidence needed, more than any graph, which brings in related but redundant information. On level 2 and 3 questions, HippoRAG retrieves between 87.9 and 90.9%. And the cost per question varies by almost three orders of magnitude:
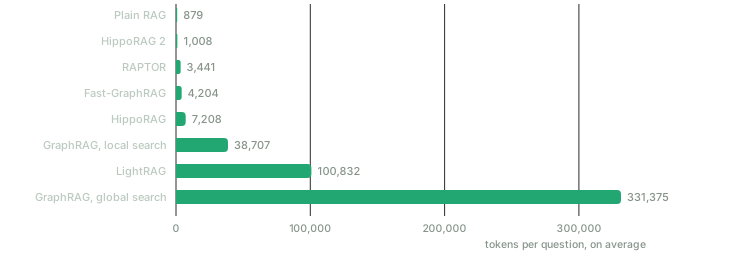
Tokens per question, on average, on GraphRAG-Bench's novel dataset (tables 6 and 7). It's the total cost of answering, not the size of one prompt: global search spreads its cost over many calls. HippoRAG 2 costs almost the same as plain RAG.
Twelve methods, the same pieces. The VLDB 2025 comparison takes twelve graph methods apart into four common pieces and measures them under the same conditions. It confirms that, for abstract questions, Microsoft's community reports are the best structure, and puts a price on them: on one of its datasets, each global-search question took about 9 minutes and used about 300,000 tokens, 57 times the time and 210 times the tokens of plain RAG.
Agents narrow the gap. The last question is the one the previous article left open: if an agent that searches in a loop already follows chains, is the graph still needed? Do We Still Need GraphRAG?, from April 2026, measures it. With a single search, GraphRAG wins by 27 points on average on multi-hop questions and by half a point on general ones. With an agent on top, plain RAG improves and closes part of that gap, and larger models close more of it: among trained agents, going from 3 to 7 billion parameters cuts it from 14.7 to 9.75 points. But it doesn't close, and the graph gives more stable results from one run to the next. The authors' conclusion is the best sentence to sum up where things stand: agents don't replace structure, they move part of it, from building the graph up front to the interaction at query time.
One warning when reading that last result: the models in that study range from 3 to 32 billion parameters. That the gap narrows further with today's largest models is what their own trend suggests, not something they measured.
What comes next
Graphs as the environment of a trained agent. Search-R1, from the previous article, used reinforcement learning to train a model to interleave reasoning and searches. Graph-R1 (ICML 2026) does the same with a graph: it builds a lightweight hypergraph, with edges that join more than two nodes at once, and trains end to end an agent that thinks, queries, retrieves a subgraph and thinks again. It isn't the last word yet: in the 2026 comparison, an untrained agent with a well-designed workflow, which decomposes the question and searches in a structured way, generally beat both Search-R1 and Graph-R1.
Graphs with dates. A fact in a graph can stop being true. If Ortega Hardware had changed plans in July, which plan was it on the day of the charge? Temporal graphs, like Zep's, from January 2025, don't delete the old edge: they give it an end date, and each relation records from when and until when it held. That is the direction agent memory is taking.
Microsoft's path. The company that popularised the name is a good barometer. LazyGraphRAG hasn't reached its open-source library: in June 2025 it was integrated into Microsoft Discovery, its scientific research platform, and into a preview of Azure Local. The library kept shipping releases (3.0, in January 2026, split it into packages), and in August 2026 its repository page began to warn that the capabilities of frontier models have changed dramatically since the first release, in July 2024, and that the project is "largely in maintenance mode". Meanwhile, at its Build 2026 conference, Microsoft announced the general availability of Graph in Fabric, a service for declaring a graph over each company's business data, meant as context for its agents. Read alongside the rest of this article, the move makes sense: the pipeline that extracted a graph from text up front is losing ground, and the other two options are gaining it, the graph built at query time and the graph that already exists.
When you need a graph
With all of the above, the choice depends on where the answer lives, not on the fashionable name:
| If the answer is… | At Albarán | Use |
|---|---|---|
| in a corpus that fits whole in the context | any question | no index: everything in the context, with caching |
| in one chunk | "What window does the Team plan have?" | hybrid RAG, no graph |
| in a chain of documents, or where two very common cues cross | "Is 4812 entitled to a refund?" | an agent; an associative memory like HippoRAG if the loop is slow or expensive |
| in the whole of a text corpus | "Why are customers asking for refunds?" | a map: communities with reports if global questions repeat; a lazy map if they're few or the corpus changes often |
| in relations already stored in a database | "How many Team plan customers…?" | a query the model writes; no extracted graph |
Before building anything, classify your questions. Take fifty real ones and note, for each, where its answer is. If nearly all of them are in one chunk or a short chain, you don't need a graph, and the 2025 comparisons say it would make your simple answers worse. If there are global questions, count how many there are and how often they repeat over the same corpus, because that decides whether the map pays for itself. And measure against a serious baseline, an agent with hybrid search and not a naive RAG, with reference answers written by someone. If you also use a judge model, show it the two answers in both orders.
What to take away
If you take away one thing, let it be this: "GraphRAG" isn't one technique, it's three different graphs for three different questions. A map of the corpus, for questions whose answer is the whole. An associative memory, to follow chains in a single step. And the graph you already have in your databases, for questions whose answer is a relation or a count. Before choosing one, ask yourself where the answer lives.
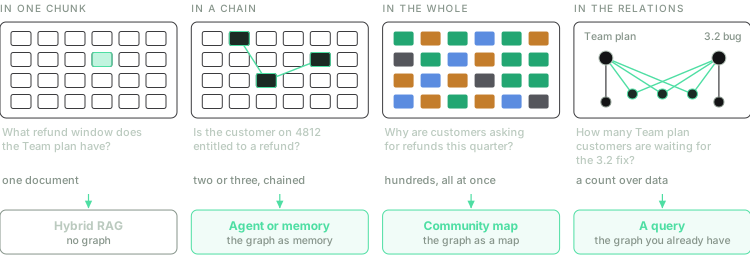
The questions from the start, with their tools. The first needs no graph; each of the other three has its own, although the second can do without it if an agent goes round the loop.
And if you take away three more things, let them be practical.
If the relation is already in a database, query it. It's the cheapest of the three options and the only exact one. A graph extracted by a model is a lossy copy of what you already had.
Only pay for the map if you'll use it. Building communities and reports means reading the whole corpus with a model, and every global question still costs hundreds of thousands of tokens. If global questions are few, or the corpus changes every day, pay for the reading at query time.
Before a graph for multi-hop, try an agent. It's what you already have if you followed the previous article, and with large models it takes back much of the graph's advantage. Move to an associative memory when the loop gets too slow or too expensive, or when your questions cross two cues that, separately, appear in thousands of documents.